Track Actual Ridership and Utilization
Why
While most schools put considerable effort into designing their transportation schedules and plans for student mobility, they don’t always have a strategy in place for gauging how these plans play out in reality. Tracking how students get to and from learning opportunities—whether at the school building or elsewhere—has multiple benefits. First, tracking actual ridership on routed vehicles and utilization of other transportation modes enables a school to determine adherence to its scheduled dismissal plan. Adherence to schedule is a strong indicator of the extent to which your plan actually represents your families’ needs. Second, tracking actual ridership is a rich source of information that can be leveraged to optimize routes, guiding insights and decisions on stop consolidation. Thoughtful elimination of underutilized stops and routes improves efficiency and reliability of core routed service. Such right-sizing has the knock-on benefit of potentially creating sufficient slack and savings to enable a system to differentiate and/or expand service. Finally, tracking actual utilization facilitates data-driven inquiry into chronic absenteeism and the extent to which transportation is a barrier to consistent student attendance.
How
- Frequency:
Spot check and sample actual utilization on a consistent basis (e.g., weekly, monthly). Tracking does not need to be done every day or for every route in order to gather useful information. - Process:
Tracking may be conducted curbside as students disembark vehicles and enter school, or dismissal. For students riding school division-routed service, tracking may also be done onboard the vehicle. Consider what kind of actions you hope to take on the data to ensure this informs your data gathering strategy. For instance, if you are hoping to identify stops that could be eliminated, you’ll need a way of tracking riders and/or count by stop. If you want to understand how to encourage more active transport, you will need a way of knowing the origin or destination for each student to understand which neighborhoods are currently considered accessible by walking or biking. - Support:
Schools may leverage operations, curbside, or attendance staff to complete tracking. For routed service, collaboration with drivers and bus aides is crucial. These staff members should be informed and engaged to ensure tracking is efficient and accurate. - Analysis:
Establish a regular schedule for analyzing utilization data, digging into data in ways that result in actionable insights—for instance, identifying groups of students and individual students whose current transportation schedule does not reflect their day-to-day reality. Look for trends in actual utilization and adherence to the dismissal plan by school, student group, neighborhood, day of the week, mode, and route. - Action:
Gathering data is only useful if it is acted upon! Share your findings with your broader school community, including staff members, caregivers/parents, and students. Engage stakeholders in dialogue to understand the story behind trends. These stakeholders can offer additional information and context that support meaningful interpretation of patterns. If data is gathered with an intentional plan for action, actual utilization data can inform adjustments at the system, group, and student level. Students who are chronically absent and not consistently utilizing their assigned mode may benefit from further inquiry or an individualized transportation plan that outlines differentiated service and supports. For example, if a student keeps oversleeping in the morning and missing their bus, they could benefit from a circulating route (service frequency), text-based vehicle ETA alerts (communication), or a later pickup time (timing).
![]()
Examples
While there are many high-tech tools for tracking ridership of individual students on vehicles—as well as comprehensive technology solutions for managing and monitoring utilization across all transportation modes—schools do not need to invest in new technologies in order to track utilization. Consider these two approaches:
- School A conducts monthly ridership audits—student by student and stop by stop across all modes—by using drivers and curbside staff to record attendance on paper. For new service interventions (e.g., a new route) and more customized service (e.g., coordinated carpooling), the school may choose to audit weekly for a period of time.
- School B uses a tech platform to record daily student counts on school-provided buses and vans using RFID cards with proximity-based detection. Special planning is needed to determine how data for individual students and stops will be synthesized to produce school and system-level insights beyond live tracking information.
![]()
Both schools need to conduct homegrown analysis to identify non-riders and intermittent users to inform routing decisions, match with attendance data, and guide inquiry and action. Tracking utilization is a powerful practice to understand your current transportation system, the extent to which it is meeting family and student needs, and what changes are needed to address chronic absenteeism.
You Might Also Be Interested In:
-
Understand Mode of Transport
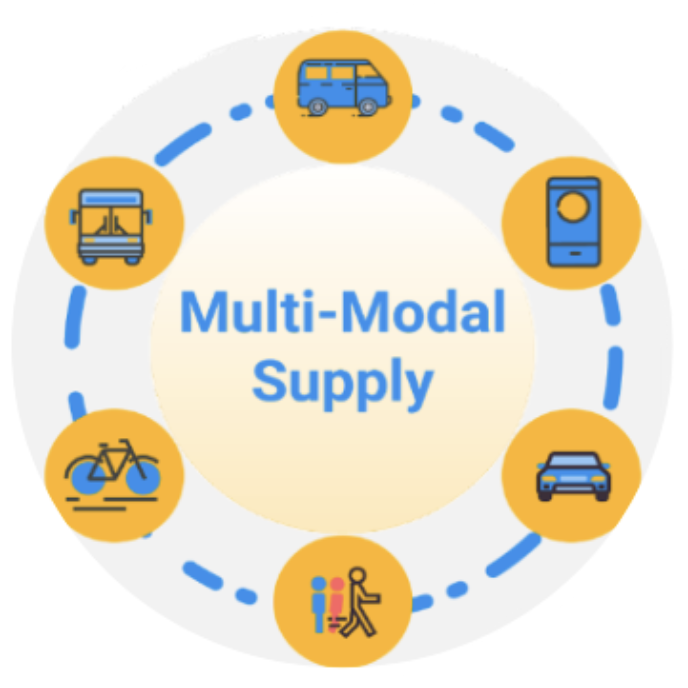
Capture and share which modes each student uses so you can find targeted solutions to attendance problems and improve parity and efficiency.Read More -
Student Mobility Policy Playbook
Seven practical policy solutions to create a more accessible, student-centered, and equitable transportation network that adds flexibility and lower costs.Read More